set.seed(10); runif(2); runif(2)[1] 0.5074782 0.3067685[1] 0.4269077 0.6931021set.seed(10); runif(4)[1] 0.5074782 0.3067685 0.4269077 0.6931021TLDR: I explain why researchers should not use the same random seed to generate variables that should not be correlated.
I have been working on a simulation for a spatial transcriptomics project. During the process of debugging the simulation, I came across an issue with setting seeds that I wanted to explore further. Setting a seed initializes a value that is used by a pseudorandom number generator.
Comparing these two lines of code shows us how a seed functions:
set.seed(10); runif(2); runif(2)[1] 0.5074782 0.3067685[1] 0.4269077 0.6931021set.seed(10); runif(4)[1] 0.5074782 0.3067685 0.4269077 0.6931021For this reason, we want to refrain from using the same random seed to generate variables that should not be correlated. For example,
set.seed(1)
alpha <- runif(50, 1, 2)

set.seed(1)
beta <- runif(25, 0.5, 4)
beta <- append(beta, runif(25, 4, 8))

plot(alpha, beta)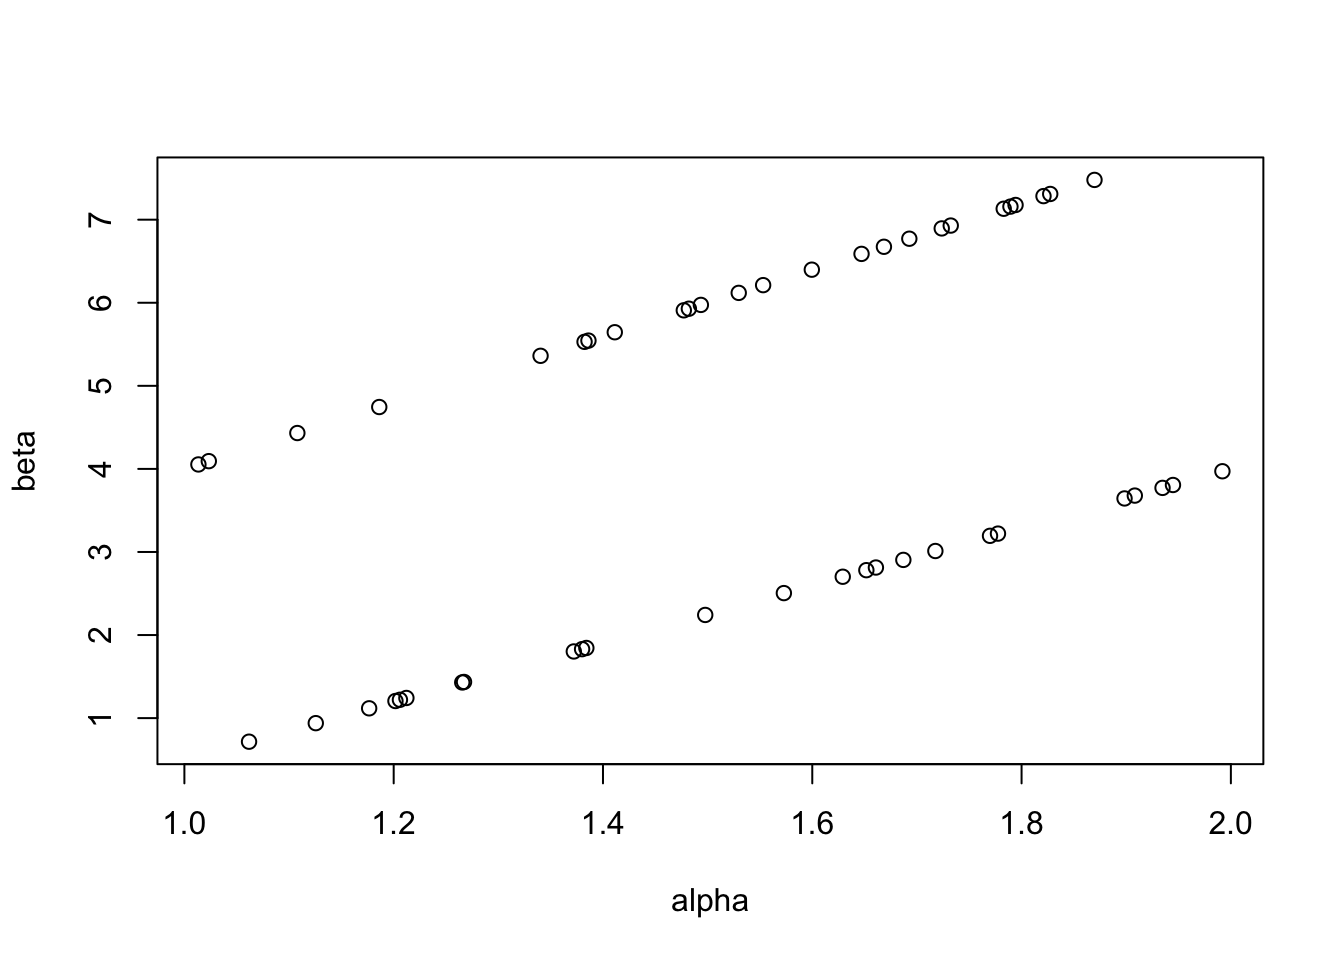
cor(alpha[1:25], beta[1:25])[1] 1cor(alpha[26:50], beta[26:50])[1] 1It is very clear when I write it in simple code like this, but I was not aware of this concern before. The same issue occurs when selecting values from any distribution.
set.seed(100)
vals1 <- rnorm(100, mean = 3, sd = 1)

set.seed(100)
vals2 <- rnorm(100, mean = 0.5, sd = 10)

plot(vals1, vals2)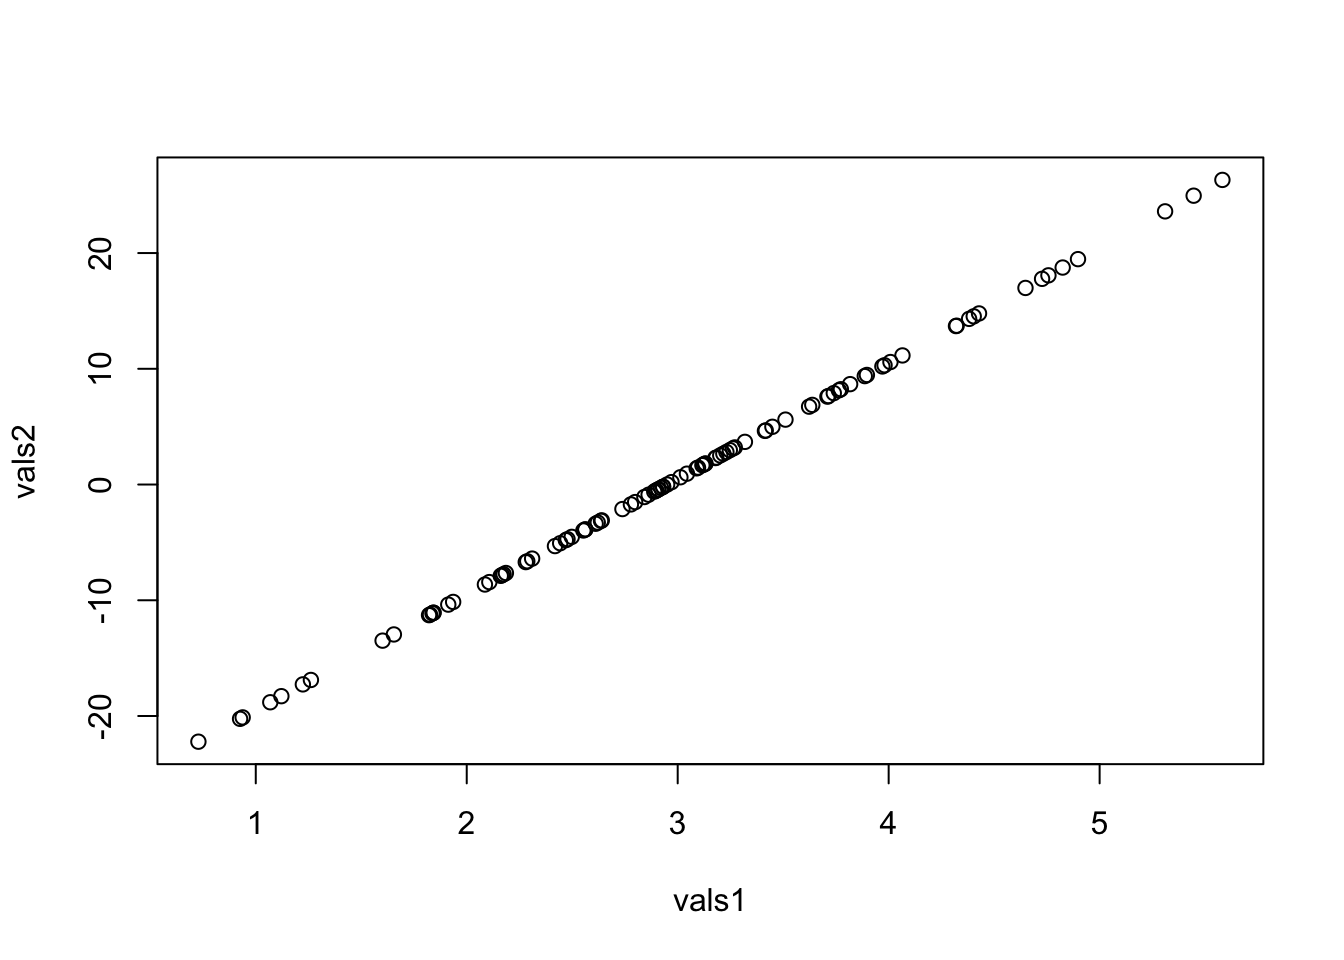
cor(vals1, vals2)[1] 1To make sure this result is not by chance, I replicated it with 50 different seeds and summarized the correlation.
correlation_list <- c()

for(i in c(1:50)){
  set.seed(i)
  vals1 <- rnorm(100, mean = i, sd = 1)

  set.seed(i)
  vals2 <- rnorm(100, mean = 0.5, sd = i)

  correlation_list <- append(correlation_list, cor(vals1, vals2))
}

correlation_list
[1] 1 1 1 1 1 1 1 1 1 1 1 1 1 1 1 1 1 1 1 1 1 1 1 1 1 1 1 1 1 1 1 1 1 1 1 1 1 1
[39] 1 1 1 1 1 1 1 1 1 1 1 1From now on, I will be implementing a better practice of setting the seed just once at the beginning (Morris and Crowther 2019).
I was under the assumption that using the same seed to simulate, say, normal and uniform data would produce correlated data as well. I found that this is actually not the case and that this correlation does not occur when selecting values from different distributions.
set.seed(9)
normal <- rnorm(100)

set.seed(9)
uniform <- runif(100)

plot(normal, uniform)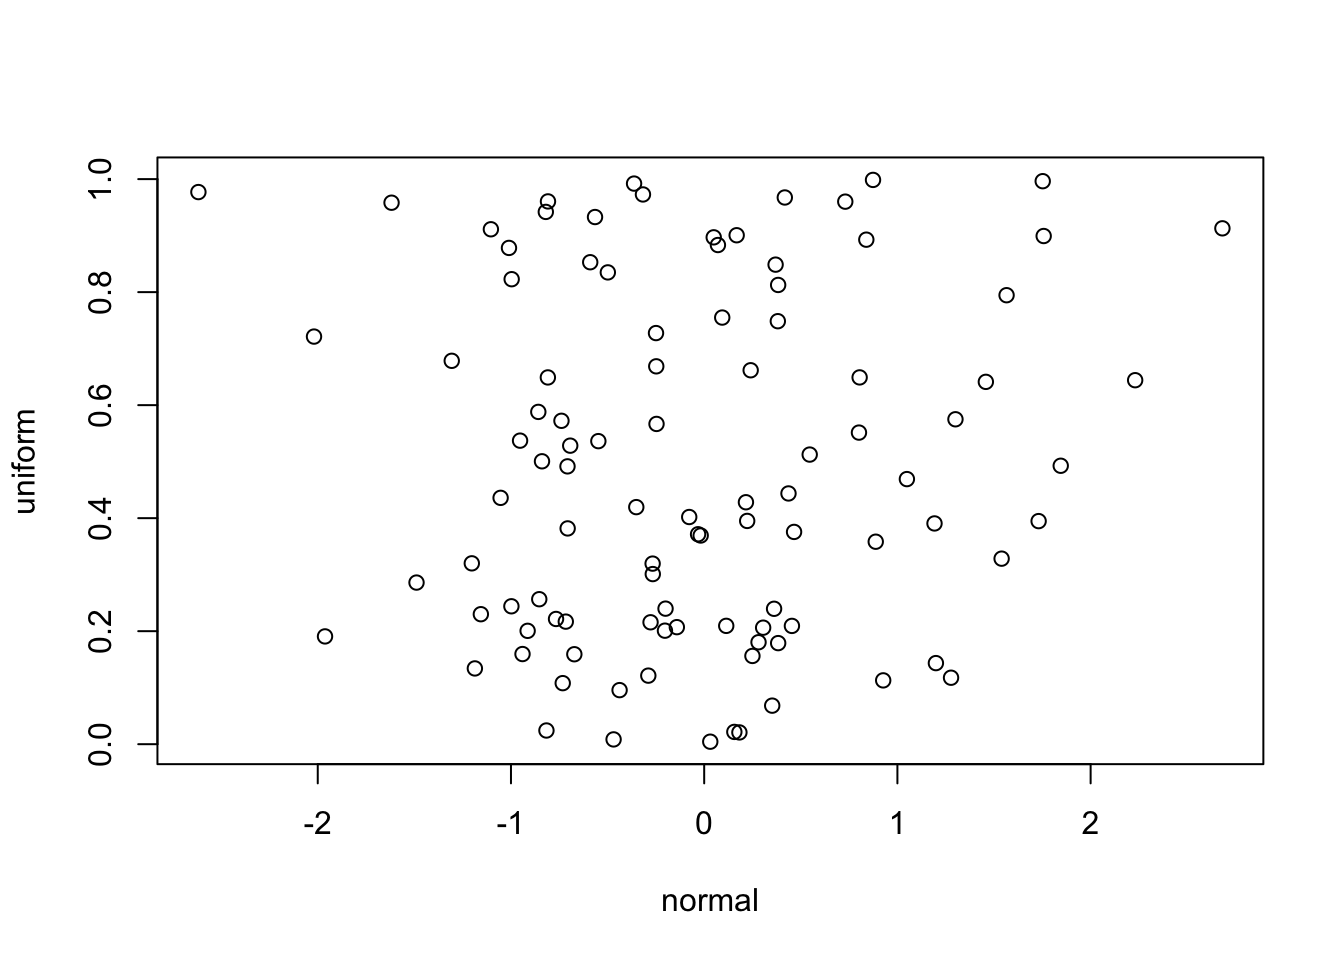
cor(normal, uniform)[1] 0.06719044This finding is counterintuitive to me as I thought that generating values from the normal distribution was just transformation of randomly generated uniform values to the normal distribution. I’m reading about the Mersenne Twister, a modern random number generator that is used in R and other languages (“Mersenne Twister” 2023), in hopes of understanding this. I would love to hear if anyone knows of an explanation for this.
Big thanks to Boyi Guo for his insights on this post!
If you found this blog post helpful and would like to support my work, feel free to buy me a coffee.